Strait of Hormuz: Industry Impact Heatmap
By Scott Covert · independent analyst & builder of the AI Stock Market Impacts engine · Ontario, Canada
15 industries scored across 4 Hormuz scenarios. Hover over any cell for the detailed analysis.
Industry Impact Under 4 Hormuz Scenarios
Hover over any cell for detailed effects. Green = positive for that industry, yellow = mixed, orange-to-red = increasingly negative.
Loading heatmap data...
Get Crisis Updates + Free Industry Impact Reports
We rescore all industries when the situation changes. Subscribers also get a free "AI vs Your Stocks" impact report for any industry.
You're in. Check your inbox.
No spam. Crisis updates, AI Revolution impact reports, and occasional updates. Unsubscribe anytime.
Resolved by Q3 2026
Ceasefire + shipping resumes by August. 5-month total disruption. Infrastructure repair needed. Prices begin normalizing but fertilizer elevated into 2027.
Closed Through Harvest
Strait stays closed through Northern Hemisphere harvest (Oct 2026). Spring planting fully disrupted. 10-20% cereal yield reduction. Food inflation severe Q4 2026.
12-Month Closure
No resolution through Feb 2027. SPR depleted. Grain reserves collapsing. Multi-year famine risk in developing nations. Recession in developed world.
Wider Conflict
Escalation beyond Hormuz: attacks on Saudi/UAE oil infrastructure, Taiwan tensions spike, multiple chokepoints disrupted. Global crisis.
Why One Narrow Waterway Moves Your Whole Portfolio
The heatmap above scores 15 industries against four outcomes. This section is the reasoning underneath it — what the Strait of Hormuz actually carries, who needs it, and how a price shock there ripples out to the parts of your portfolio that have nothing obvious to do with oil. The point isn't to scare you into a trade. It's to show you which holdings are quietly exposed to a chokepoint most people couldn't find on a map.
The chokepoint, in numbers
At its narrowest the strait is about 24 miles wide, and the usable shipping is even tighter: an inbound lane and an outbound lane, each roughly 2 miles across, separated by a 2-mile median. Tankers have very little room to reroute around trouble.
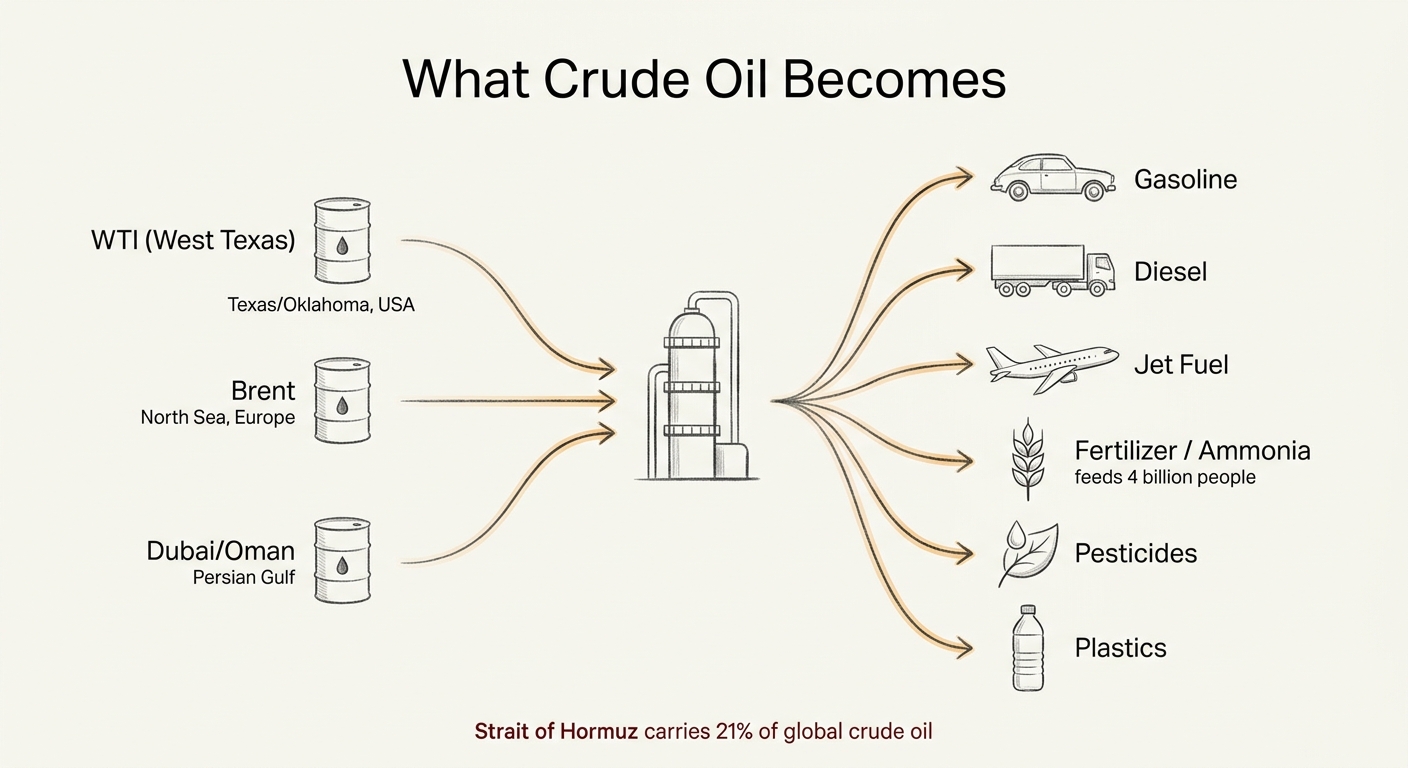
Through that gap moves about 20 million barrels of oil a day — roughly a fifth of all the petroleum liquids the world consumes, and around a quarter of all seaborne oil trade. Of that flow, the U.S. Energy Information Administration puts crude and condensate near 15 million barrels a day and refined products (diesel, jet fuel, fuel oil) at about 5.5 million. It's also a gas chokepoint: roughly 20% of global LNG trade passes through, including the overwhelming majority of Qatar's exports (Qatar is the world's No. 2 LNG supplier) and nearly all of the UAE's. There is no pipeline that can carry LNG around the strait. If it shuts, that gas simply doesn't ship.
Who actually depends on it
On the supply side it's the Gulf exporters — Saudi Arabia, the UAE, Iraq, Kuwait, Qatar, and Iran — whose barrels have no other ocean exit. On the demand side, the dependence is overwhelmingly Asian. EIA figures for early 2025 put China at about 38% of the crude and condensate leaving the strait, India near 15%, South Korea around 12%, and Japan close to 11%. Asia as a whole takes roughly 89% of it. That matters for a U.S. or Canadian investor in a non-obvious way: a Hormuz event is a direct hit to the manufacturing engines of Asia, which is where a lot of global earnings actually come from, including the supply chains behind American tech and consumer brands.
What the bypass routes can — and can't — do
Two pipelines exist to dodge the strait: Saudi Arabia's East-West line to the Red Sea port of Yanbu, built during the Iran-Iraq war for exactly this reason, and a shorter UAE line to Fujairah on the Gulf of Oman. They help, but they don't replace the strait. The IEA estimates only about 4 million barrels a day of the flow can be redirected through spare pipeline capacity, which leaves on the order of 16 million barrels a day at risk in a full closure. And those bypass assets aren't untouchable — the Fujairah route and port have come under attack before, which is the practical reason "just use the pipelines" is thinner comfort than it sounds.
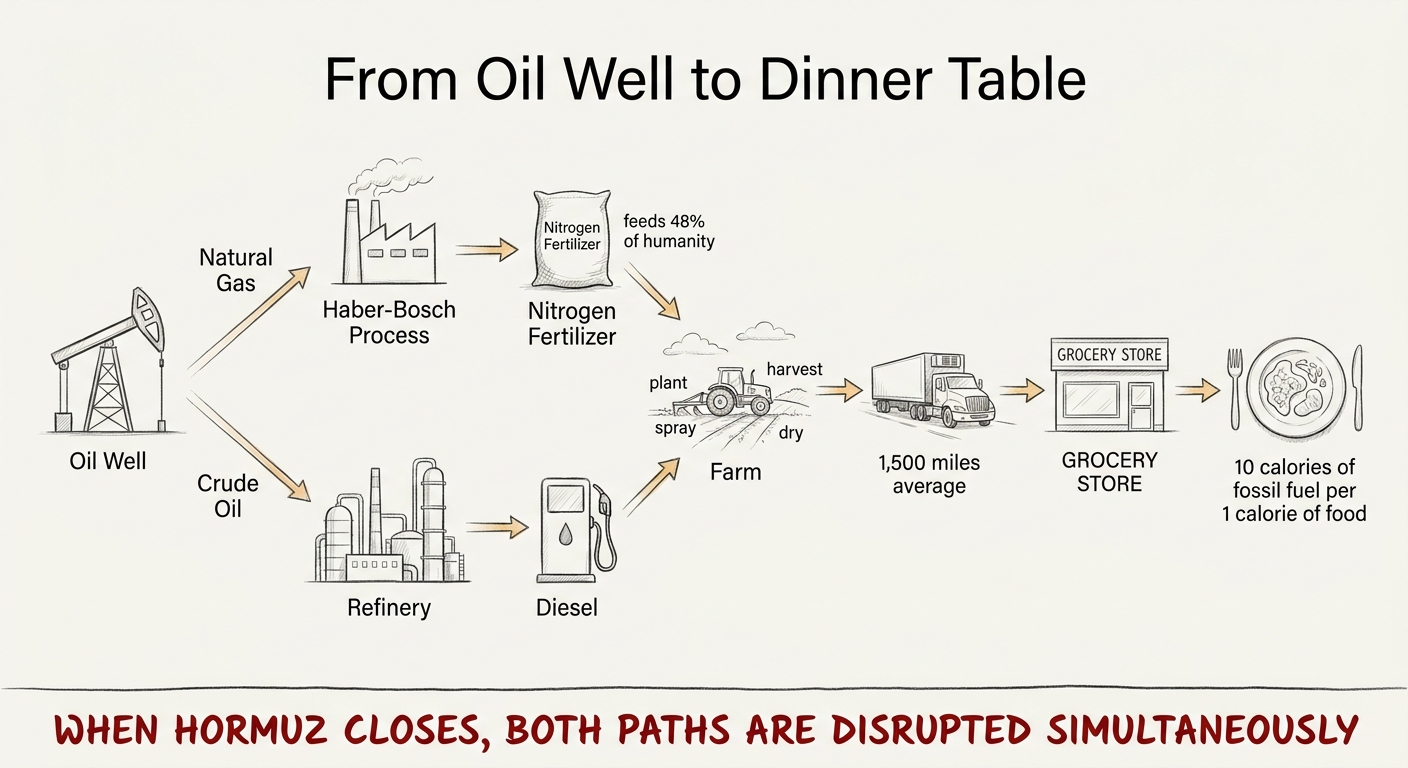
What disruption does to oil — and then to everything else
History says the price reaction is fast and the size depends entirely on whether barrels actually stop moving. In the 1980s "Tanker War," Iran attacked dozens of ships in the strait, yet prices stayed soft because the world was oversupplied at the time — a useful reminder that fear alone doesn't move oil; lost barrels do. The more recent pattern is sharper. When the U.S. and Israel struck Iran in June 2025, Brent jumped from roughly $65 into the low $80s, then gave most of it back once traders concluded supply wasn't actually being cut. When flows genuinely seized up in early 2026, Brent ran from about $72 toward $120 — one of the largest one-month moves on record.
For scale: Goldman Sachs has estimated Brent near $110 if Hormuz flows are halved for a month, north of $100 if the strait stays shut for weeks, and a $115–120 range if something like 2 million barrels a day stays offline. Those are scenarios, not forecasts — which is the same spirit as the heatmap above.
The second-order effects are where a portfolio that "isn't in energy" still gets hit:
- Energy names tend to rise. Producers and integrated majors earn more per barrel; the energy sector has outrun the broad market badly in past oil shocks (in the first half of 2026, the energy sector index outpaced the S&P 500 by more than 12 points).
- Airlines, shipping, and transports get squeezed. Jet fuel is one of an airline's biggest costs; in this episode it ran up around 40% year over year, and at least one major carrier issued a profit warning over it. Freight and logistics feel the same diesel pressure.
- Consumer discretionary leaks. When households spend more on gasoline and heating, they spend less on the optional stuff — retail, restaurants, travel. Big-box retailers flagged transportation and utility costs as a drag during this period.
- Inflation and the Fed. An energy spike feeds straight into headline inflation, which makes it harder for the Federal Reserve to cut rates. That's the link from a tanker lane in the Persian Gulf to your bond holdings and your rate-sensitive growth stocks. The IMF trimmed its 2026 global growth view toward 3.1% while nudging inflation up toward 4.4% — the stagflation-flavored mix oil shocks tend to produce.
What it means for how you hold
The practical read isn't "buy oil, sell airlines" on a headline — markets price the obvious move within minutes. It's to know, before anything happens, which of your positions sit on the wrong side of a Hormuz event: the fuel-heavy transport name, the discretionary retailer running on a thin margin, the rate-sensitive grower that needs Fed cuts to keep its valuation. The strait is a low-probability, high-consequence variable. You don't have to predict it. You do have to know what it would do to what you already own — which is exactly what the heatmap is built to show.
This Is One Variable. Our Engine Tracks 167.
Hormuz is devastating, but it's temporary. AI is restructuring every one of these industries permanently. Our engine maps AI disruption × energy × geopolitics × 167 cross-industry cascade effects across 28 industries and 5 time horizons.
Build your own "what if" scenario and see what it does to 28 industries.
Try the Free AI-Stocks MatrixFree tier. Google login. Same engine our paid members use.
Sources & Methodology
EIA (oil transit, SPR data), IEA (jet fuel analysis), FAO (Food Price Index), USDA (fertilizer costs, planting data), DTN (fertilizer market prices), market data (Brent, WTI, Henry Hub, TTF), NECSI (political instability threshold), Erisman et al. Nature Geoscience (Haber-Bosch dependency), Pimentel/Cornell (food-energy ratios), scovert.com crisis-monitor brain (127 entries). Scores: green = positive, yellow = mixed, orange-to-red = increasingly negative impact.
Figures in the explainer above are drawn from the following:
- EIA — Strait of Hormuz oil chokepoint (volume, ~20% of petroleum liquids, destination shares)
- EIA — About one-fifth of global LNG flows through the Strait of Hormuz
- IEA — Strait of Hormuz overview (LNG share, redirectable spare capacity)
- Strait of Hormuz — geography, width, and shipping-lane dimensions
- Visual Capitalist — oil trade through the strait by destination country
- Goldman Sachs — Iran conflict / Hormuz oil-price scenarios
- CNBC — timeline of how the Iran war shook oil prices